伴或不伴负性视光障碍的假晶状体眼视网膜照度#
科学出版物的补充材料:
van vught L,Que I,Luyten GPM,Beatakker JWM. Effect of anatomical diferences and intraocular lens design onNegative Dysphotopsia. Journal of Cataract & Refractive Surgery: September 06, 2022.DOI:10.1097/j.jcrs.000000000000001054
这些补充材料包括:
具有特定解剖特征的阴性视力障碍患者和假性视力对照眼模型
通过ZOSPy API自动确定Zemax OpticStudio中的视网膜照明的Python脚本
使用这些数据/脚本时,请引用上述论文。
提出的代码和数据仅用于研究目的,无法从中获得任何权利。 这些方法已使用Opticstudio 2024R1,Python 3.11和ZOSPy 1.2.1进行了测试。
在运行脚本之前,请确保将此脚本提供的STL文件复制到OpticstudioObjects/CAD Files文件夹。
包括功能#
非序列模式:
执行非序列光线追迹。
从
CAD Part:stl读取探测器数据。
引用#
在使用本例或本例中提供的数据时,除了引用引用ZOSPy外,还请引用以下论文:
van vught L,Que I,Luyten GPM,Beatakker JWM. Effect of anatomical diferences and intraocular lens design onNegative Dysphotopsia. Journal of Cataract & Refractive Surgery: September 06, 2022.DOI:10.1097/j.jcrs.000000000000001054
保修和责任#
提供的代码和数据仅用于研究目的。没有保证,权利不能从它们中得出,正如该存储库的一般许可中所述。
导入依赖项#
[1]:
import matplotlib.pyplot as plt
import numpy as np
from mpl_toolkits.mplot3d import Axes3D

import zospy as zp
[2]:
def set_axes_equal_3d(ax):
    """Set equal axis scales for 3D plots.

    Make axes of 3D plot have equal scale so that spheres appear as spheres,
    cubes as cubes, etc.  This is one possible solution to Matplotlib's
    ax.set_aspect('equal') and ax.axis('equal') not working for 3D.

    Parameters
    ----------
    ax
        A matplotlib axis, e.g., as output from `plt.gca()`.
    """
    x_limits = ax.get_xlim3d()
    y_limits = ax.get_ylim3d()
    z_limits = ax.get_zlim3d()

    x_range = abs(x_limits[1] - x_limits[0])
    x_middle = np.mean(x_limits)
    y_range = abs(y_limits[1] - y_limits[0])
    y_middle = np.mean(y_limits)
    z_range = abs(z_limits[1] - z_limits[0])
    z_middle = np.mean(z_limits)

    # The plot bounding box is a sphere in the sense of the infinity
    # norm, hence I call half the max range the plot radius.
    plot_radius = 0.5 * max([x_range, y_range, z_range])

    ax.set_xlim3d([x_middle - plot_radius, x_middle + plot_radius])
    ax.set_ylim3d([y_middle - plot_radius, y_middle + plot_radius])
    ax.set_zlim3d([z_middle - plot_radius, z_middle + plot_radius])
连接到Opticstudio。确保在Zemax Opticstudio打开“交互式扩展”模式(Programming > Interactive Extension)。
[ ]:
zos = zp.ZOS()
oss = zos.connect("extension")
为模拟设置一些变量
[ ]:
pachy = 0.55
cornea_iris_distance = 3.12
object_distance = 30  # distance object -> pupil center
将模型加载到Opticstudio中并运行分析
[ ]:
results = {}

for model in ["NegativeDysphotopsia", "PseudophakicControl"]:
    oss.load(model + "Model.zmx")

    # Get pointers to source and retina objects
    obj_source = oss.NCE.GetObjectAt(2)
    obj_retina = oss.NCE.GetObjectAt(14)

    # Set number of rays
    obj_source.GetCellAt(12).Value = str(1e5)

    first = True  # use this to get position of detectors on first analysis only
    results[model] = {"Irradiance": {}, "AbsorbedIrradiance": {}, "Flux": {}, "AbsorbedFlux": {}}

    for angle in range(0, 165, 5):
        xnew = np.sin(np.deg2rad(angle)) * object_distance
        znew = np.cos(np.deg2rad(angle)) * object_distance
        obj_source.XPosition = xnew
        obj_source.ZPosition = -(znew - pachy - cornea_iris_distance)
        obj_source.TiltAboutY = -angle

        # Trace
        RayTrace = oss.Tools.OpenNSCRayTrace()
        RayTrace.NumberOfCores = 8
        RayTrace.ClearDetectors(0)  # clear the old detector data!
        RayTrace.ScatterNSCRays = True
        RayTrace.UsePolarization = False
        RayTrace.SplitNSCRays = False
        RayTrace.IgnoreErrors = True
        RayTrace.RunAndWaitForCompletion()
        RayTrace.Close()

        # Get data
        fd = obj_retina.GetFacetedObjectData()

        centroids = []
        irradiance = []
        absorbed_irradiance = []
        flux = []
        absorbed_flux = []

        for face_number in range(fd.NumberOfFaces):
            fd.CurrentFace = face_number

            if first:
                vertices = np.array(
                    [list(fd.GetVertex(vertex_number)[1:]) for vertex_number in range(fd.NumberOfVertices)]
                )
                centroids.append(vertices.mean(axis=0))

            irradiance.append(fd.Irradiance)
            absorbed_irradiance.append(fd.AbsorbedIrradiance)
            flux.append(fd.Flux)
            absorbed_flux.append(fd.AbsorbedFlux)

        if first:
            results[model]["Centroids"] = np.array(centroids)
            first = False  # Make sure centroids are only read in once

        results[model]["Irradiance"][angle] = np.array(irradiance)
        results[model]["AbsorbedIrradiance"][angle] = np.array(absorbed_irradiance)
        results[model]["Flux"][angle] = np.array(flux)
        results[model]["AbsorbedFlux"][angle] = np.array(absorbed_flux)
可视化结果
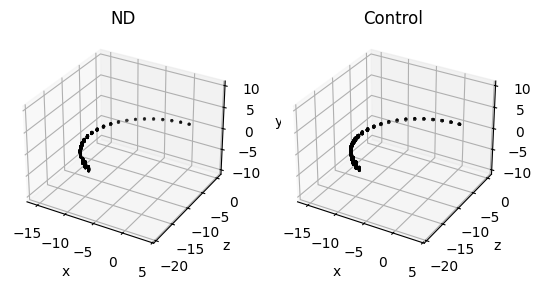
[ ]:
# Show results
cumulative_irradiance_nd = np.array(
    [results["NegativeDysphotopsia"]["Irradiance"][key] for key in results["NegativeDysphotopsia"]["Irradiance"]]
).sum(axis=0)

cumulative_irradiance_co = np.array(
    [results["PseudophakicControl"]["Irradiance"][key] for key in results["PseudophakicControl"]["Irradiance"]]
).sum(axis=0)

fig = plt.figure()
ax1 = fig.add_subplot(121, projection=Axes3D.name)
ax2 = fig.add_subplot(122, projection=Axes3D.name)

vmax = np.max([cumulative_irradiance_nd.max(), cumulative_irradiance_co.max()])
filter_nd = cumulative_irradiance_nd != 0
ax1.scatter(
    *results["NegativeDysphotopsia"]["Centroids"][filter_nd].T[np.array([0, 2, 1])],
    c=cumulative_irradiance_nd[filter_nd],
    cmap="Greys_r",
    vmin=0,
    vmax=vmax,
    s=1,
)

filter_co = cumulative_irradiance_co != 0
ax2.scatter(
    *results["PseudophakicControl"]["Centroids"][filter_co].T[np.array([0, 2, 1])],
    c=cumulative_irradiance_co[filter_co],
    cmap="Greys_r",
    vmin=0,
    vmax=vmax,
    s=1,
)

ax1.set_title("ND")
ax2.set_title("Control")

set_axes_equal_3d(ax1)
set_axes_equal_3d(ax2)

ax1.set_xlabel("x")
ax1.set_ylabel("z")
ax1.set_zlabel("y")

ax2.set_xlabel("x")
ax2.set_ylabel("z")
ax2.set_zlabel("y")
Text(0.5, 0, 'y')